Want to Adapt Salesforce to the Growing Needs of your Business?
We have 20+ years of experience in Salesforce customization, configuration, and best custom development practices.
Are you a sales manager looking for insights into your team’s performance and future revenue projections?
While simply inputting data into your CRM is a step in the right direction, sales reports in Salesforce offer way more. They allow you to analyze your pipeline, track team productivity, and pinpoint growth opportunities.
This post delves into the capabilities of the Sales Cloud, a Salesforce product with pre-built reports and tools for fine-tuning these reports to best fit your needs. Let’s dive into what a Salesforce report really is and what are the best Salesforce sales reports and sales operations dashboards.
The sales department is a cornerstone of any organization, necessitating timely and well-organized data for impactful decision-making.
Concise sales reports guide pivotal company choices, from product strategy to employee bonuses. Effective use of CRM systems, like Salesforce, empowers sales teams.
If you’re new to Salesforce, consider the “Reports & Dashboards for Lightning Experience” on Trailhead, Salesforce’s free education platform. It helps understand the basics of how to create reports and dashboards for sales and marketing managers using Report Builder’s features.
Before discussing the creation of optimal Salesforce Sales Cloud reports and dashboards, it’s essential to gather relevant data, choose the right metrics, and understand your buyer persona.
The main purpose of all sales operations reports is to answer the following questions:
With organized data, you can better identify your clients’ pain points and tailor your communication.
To have a comprehensive view, you need to have both the business and personal information of your customer.
Here is, the data, that you should always collect:
You can further enrich and segment this data with more related facts:
Of course, the data you collect for detailed sales reports can go beyond the mentioned ideas, depending on your business specifics.
Generally, you can segment all the client information by the following criteria:
You can also categorize leads, such as identifying lost leads by their reasons, to develop strategies to win them back.
After choosing your data and grouping criteria, score the leads based on activities most likely to lead to a purchase, such as:
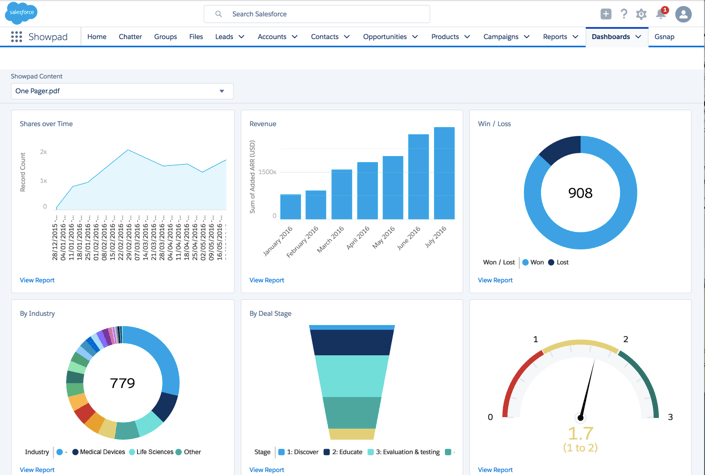
Content Reporting in Salesforce for Tracking Content Marketing Success
After classifying the data, prioritize leads by sales stage, opportunity, industry, or product. This aids in identifying less effective sales activities, such as engaging with non-promising leads or investing too much time in non-sales-related tasks.
We have 20+ years of experience in Salesforce customization, configuration, and best custom development practices.
For a precise report, decide on a timeframe: weekly, monthly, quarterly, or yearly. This choice will reveal trends in sales cycles, customer behaviors, and marketing outcomes, highlighting sales patterns or product launch successes.
The best sales reports should present data clearly and actionably. Consider how to display results, whether through bar graphs for product performance or pie charts to show individual product contributions.
The visual representation of your report isn’t just about making them beautiful but also about making them cohesive and comprehensive.
Search for the best Salesforce dashboard examples on the Internet or ask a Salesforce consultant for advice.
For accurate reports, you need clean, accurate data. CRM tools, like Salesforce, ensure client information is consistent and up-to-date.
By routinely cleansing your data ,you can analyze pertinent details effectively. For example, Salesforce’s data quality dashboards can spotlight gaps in contact or industry data.
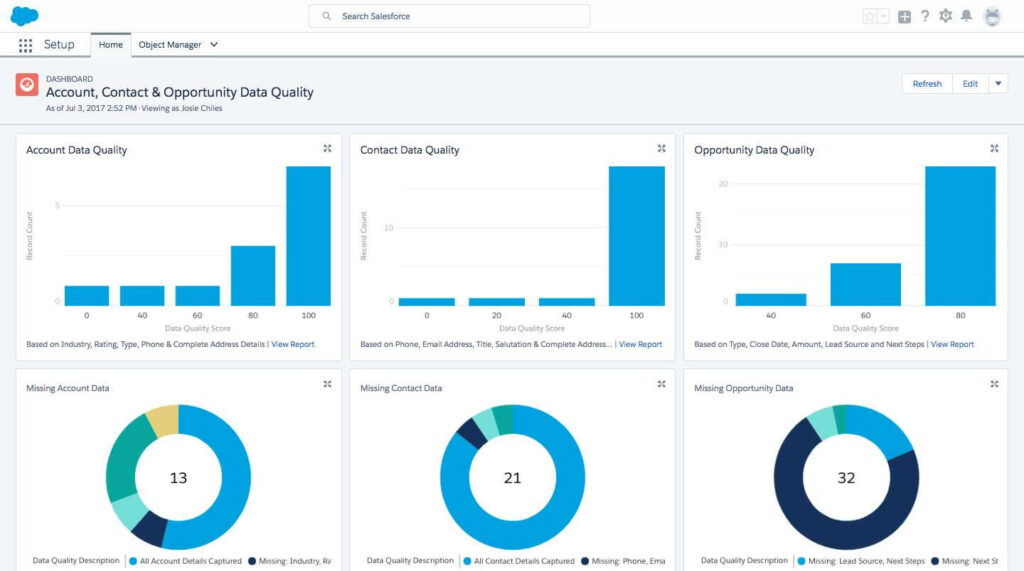
Account, Contact, Opportunity Data Quality Reports in Salesforce
Generally, all businesses need to keep a hand on the pulse of the following numbers, measurements, and activities:
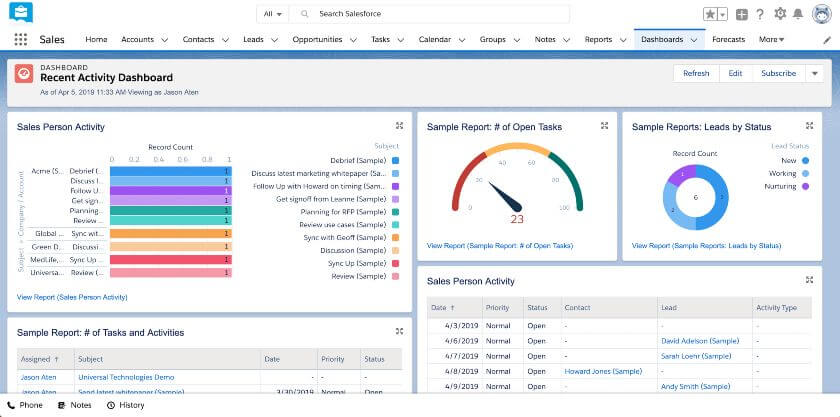
An Example of a Salesforce CRM Dashboard for a Recent Activity of a Sales Rep
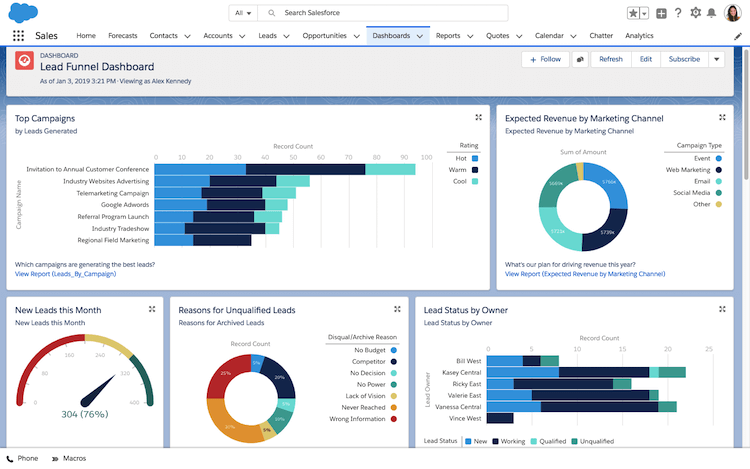
Lead Funnel Dashboard with New Leads, Reasons for Unqualified Leads Salesforce Reports Examples
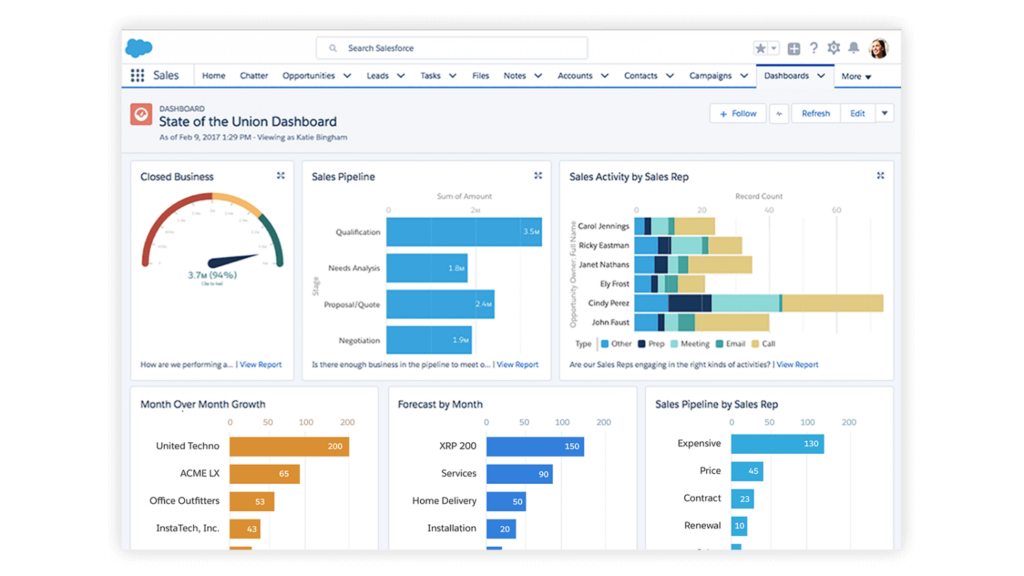
The Example of State of Union Dashboard in Salesforce for Tracking Sales Pipeline per Sales Rep and Month-to-Month Growth
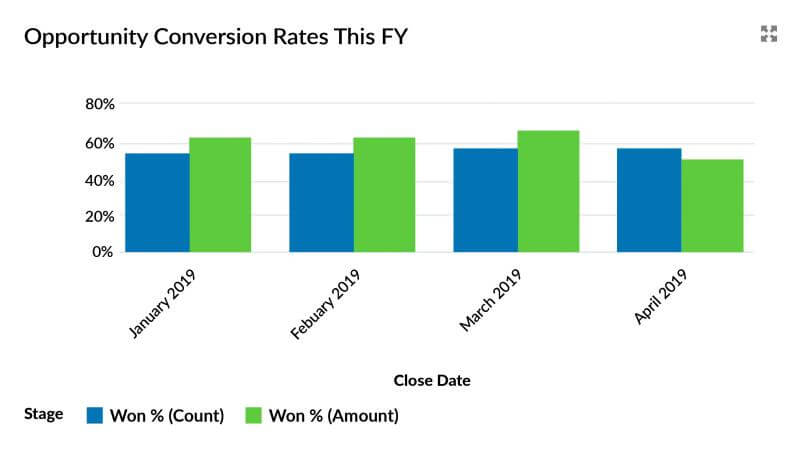
Opportunity Conversion Rates Salesforce Report
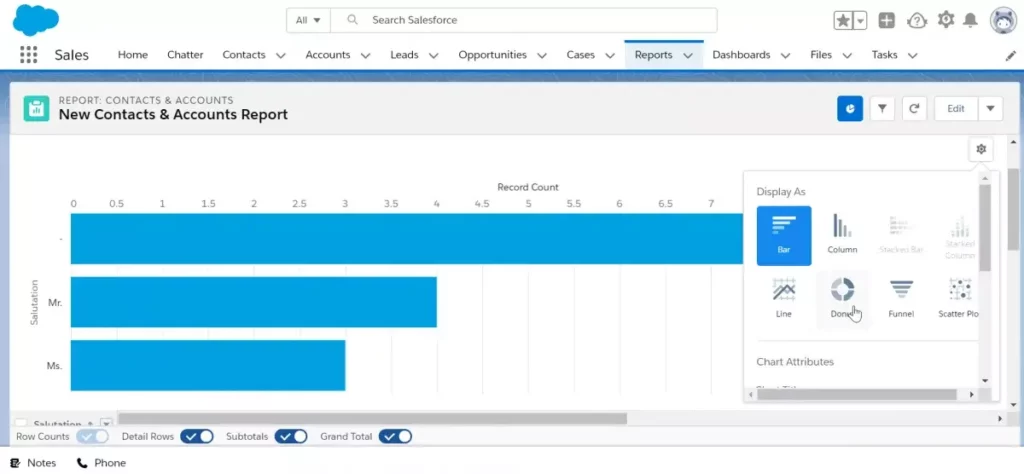
The Example of New Accounts and Contacts Salesforce Reports
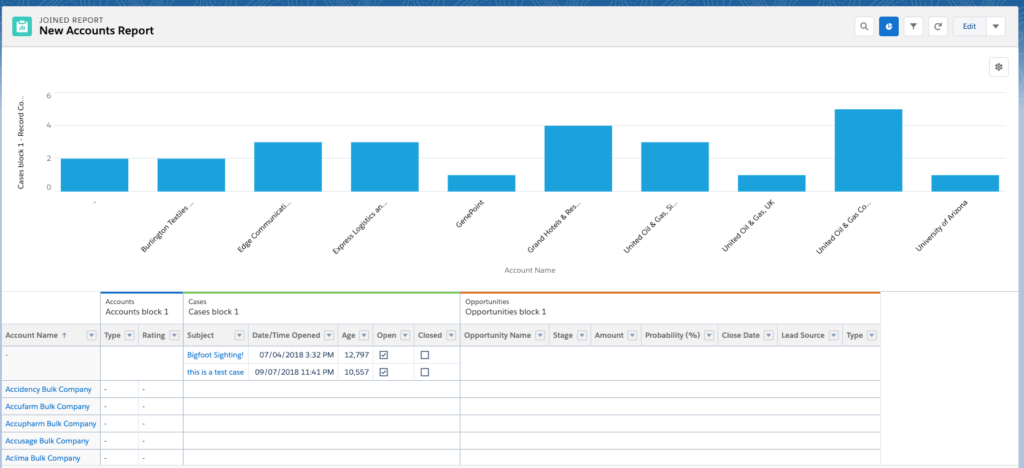
The Example of New Accounts Salesforce Report
Salesforce allows for diverse report analysis, with data grouped and displayed on dashboards. You can monitor:
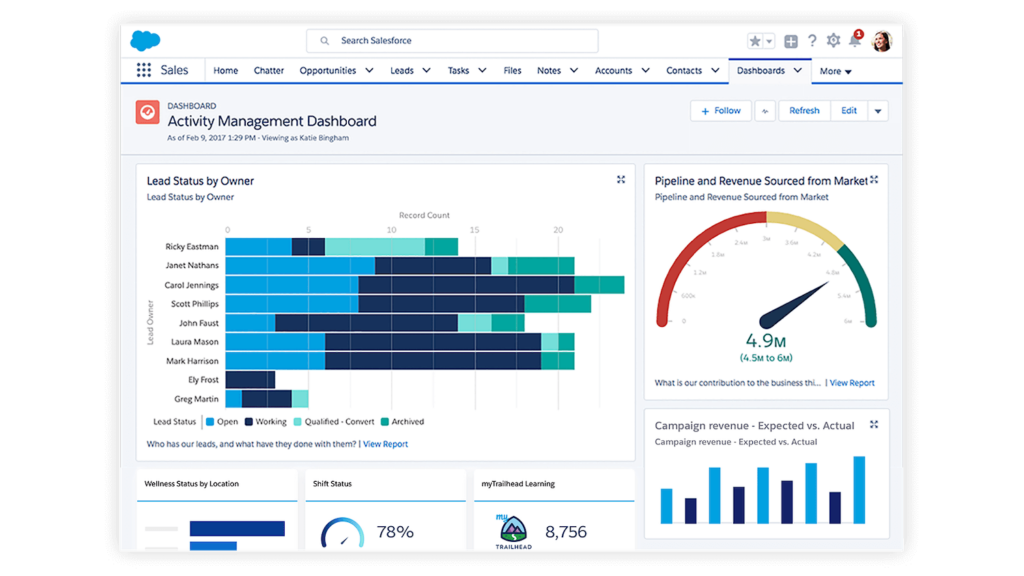
The Example of Salesforce Sales Rep Dashboard in Salesforce with Expected vs. Actual Campaign Revenue Report
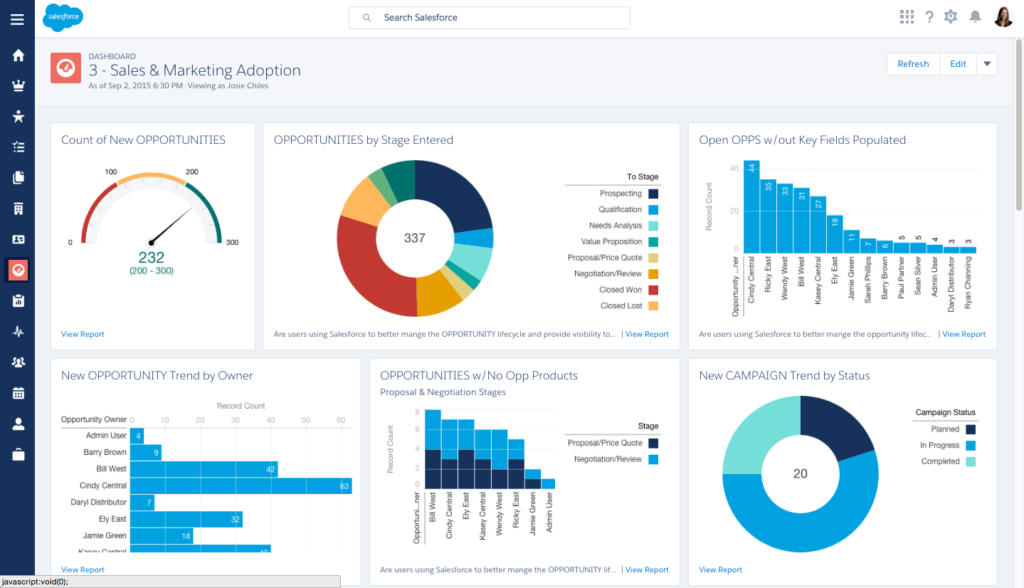
The Example of Sales Manager Dashboard in Salesforce with Open Opportunities Without Key Fields Populated Report
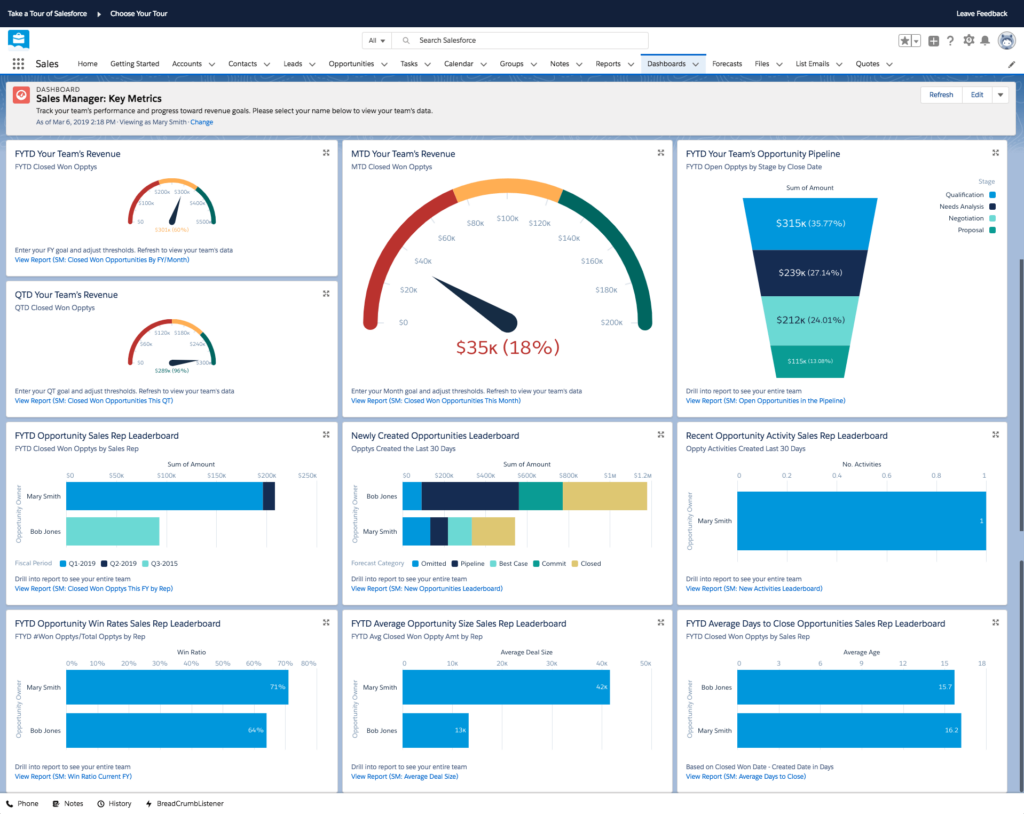
The Example of Sales Managers Key Metrics Dashboard in Salesforce with the Number of Newly Created Opportunities Report
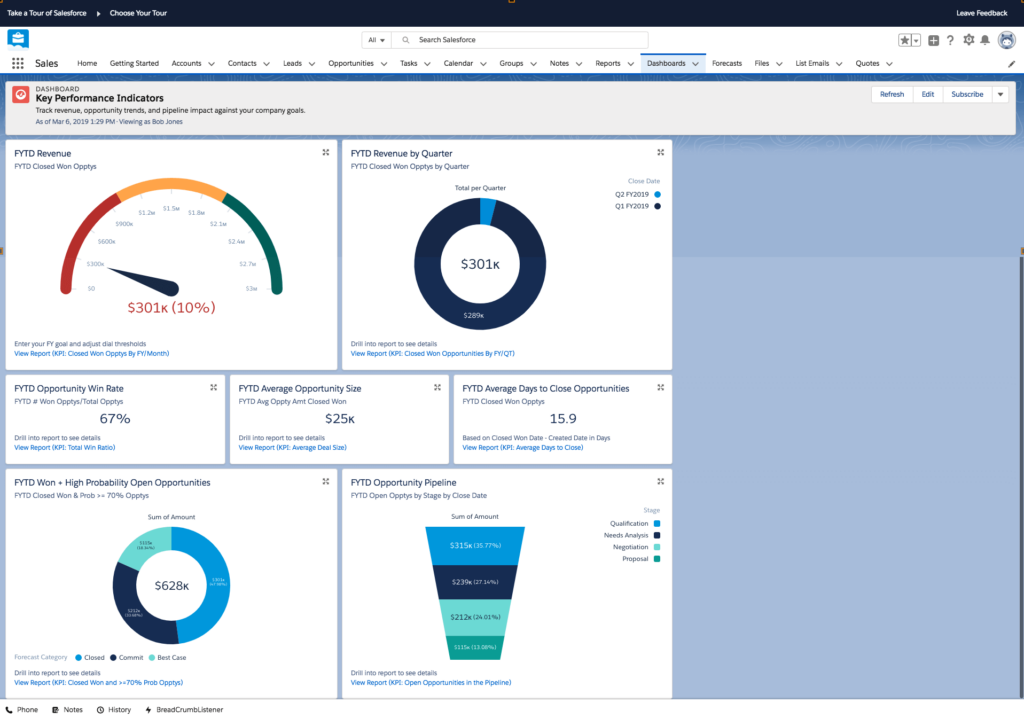
One of the Best Sales Dashboards in Salesforce to Highlight Key Performance with Average Opportunity Size Report
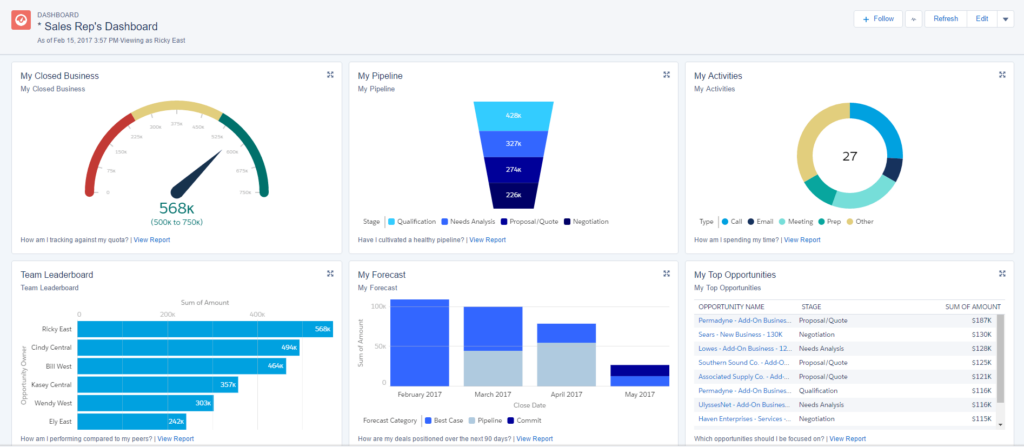
Sales Reps Performance Dashboard in Salesforce with Sales Rep’s Activities’ Report
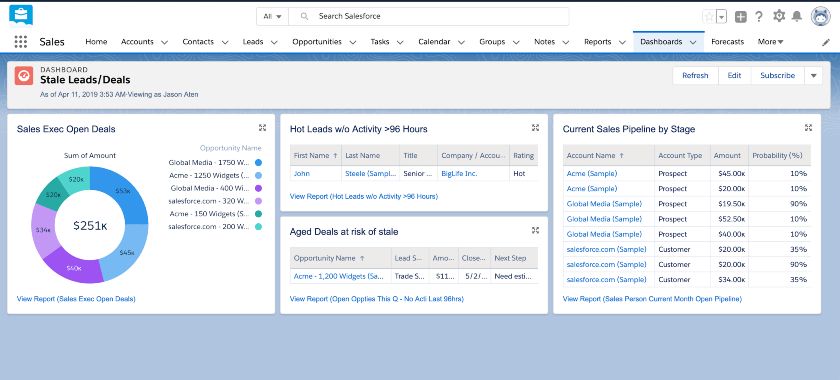
Stale Leads Deals Dashboard in Salesforce with Hot Leads Report
The mentioned metrics are just a starting point. You can customize them based on your specific needs. For instance, a commercial real estate broker might track ‘Deals by Property’.
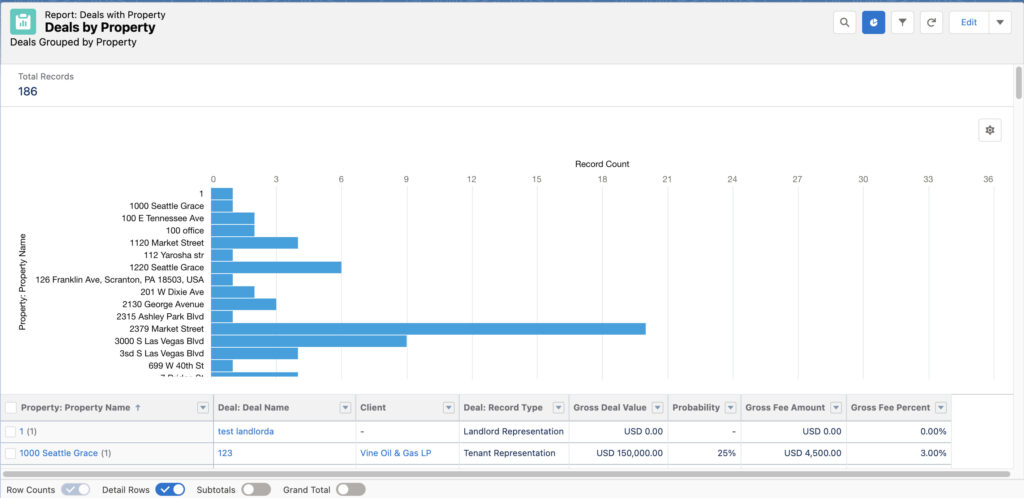
Deals by Property Report In AscendixRE CRM
Or Availabilities by Property
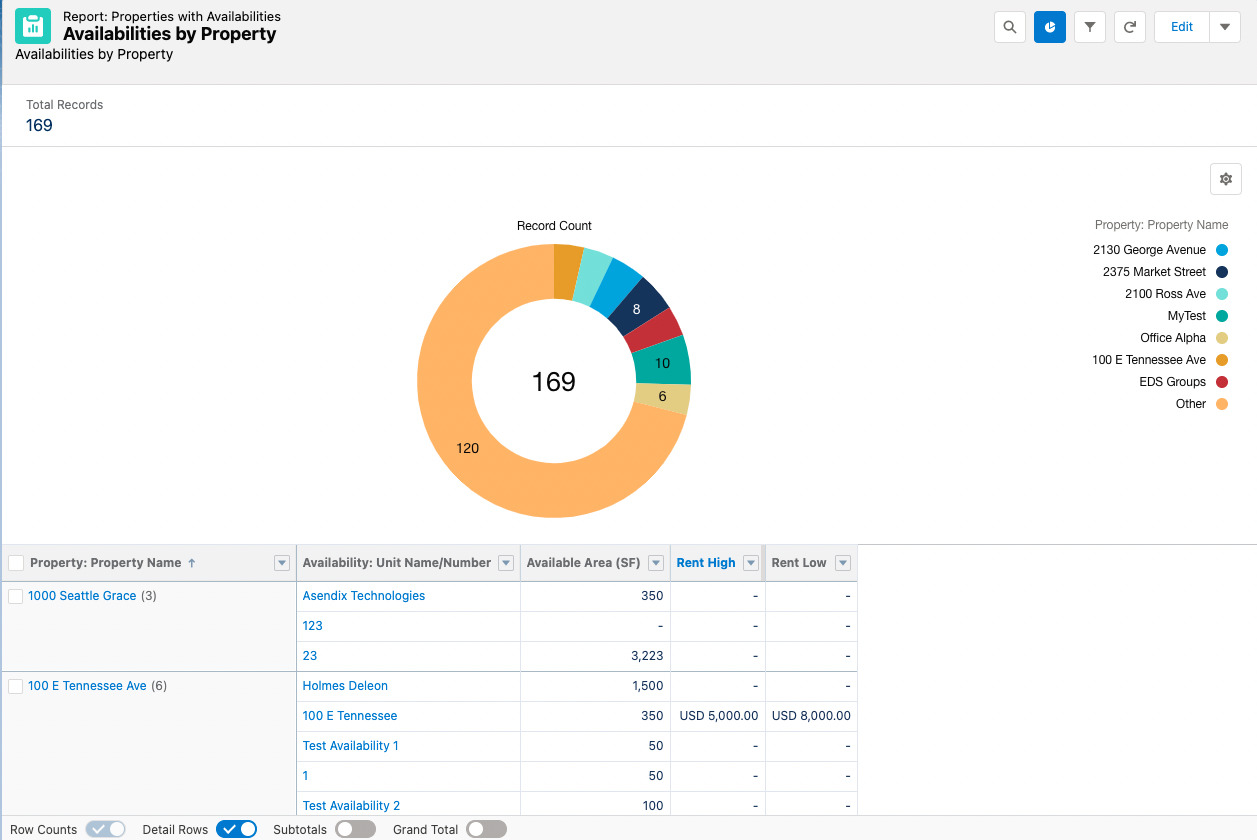
Availabilities by Property Report in AscendixRE CRM
Unfortunately, most of such custom fields and objects like Properties, Availabilities, etc. are not available out-of-the-box in Salesforce.
To tailor these features, you can either buy industry-specific Salesforce add-ons, like AscendixRE CRM for commercial real estate , or seek professional Salesforce customization services.
Get the tried and tested tips on setting up standard system functionality and optimization of your Salesforce solution from our professionals!
Now, we’ll show the three most used reports for sales managers and how they help to get the instant answers to the most burning sales-related questions and adjust the decisions accordingly.
The required data to build this report is the number of:
The productivity report compares actual results to set benchmarks, addressing crucial questions for sales teams and the entire business:
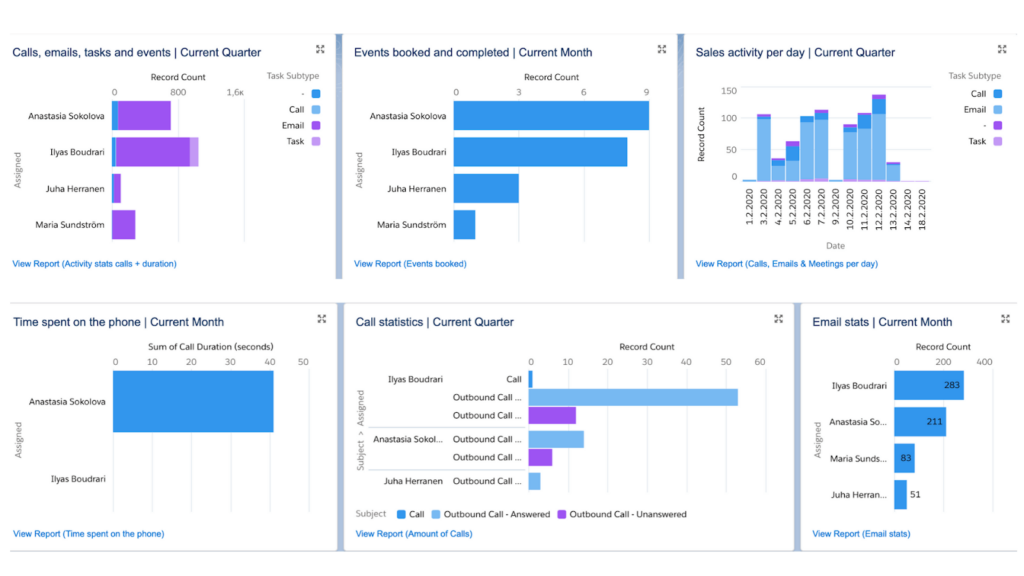
The Example of a Productivity Report in Salesforce
This report tracks prospects by their stage in the sales cycle. It lets sales managers monitor the number of prospects at each phase and observe their progression speed or if they drop off.
There are five typical pipeline stages:
Stage #1 – Decision-maker shows interest in the product or service
Stage #2 – Sales rep meets with a decision-maker
Stage #3 – Salesperson showcases product demo to a decision-maker
Stage #4 – Proposal Offered
Stage #5 – Sale Won or Lost
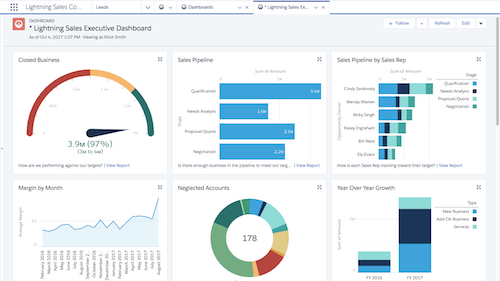
An Example of a Sales Executive Dashboard in Salesforce with a Sales Pipeline
This report allows sales managers to hold sales reps accountable for monthly deal targets and pinpoint opportunities needing special attention.
It helps project revenue and paves the way to the after-sale product/service delivery by answering questions such as:
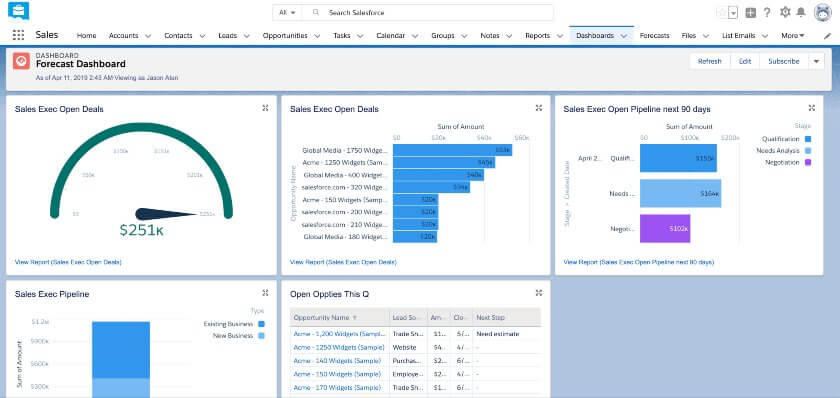
One of the Examples of Forecast Dashboard in Salesforce
If you don’t want to overcomplicate reporting experience in your organization, delegate all Salesforce-related challenges to our experts.
Here’s how we can assist with the customization of Salesforce reports and dashboards:
Or you can go another way and use our pre-made app, Ascendix Search, for advanced searches, map-based results, or to edit multiple records at once.
We built the Ascendix Search app to upgrade your Salesforce experience and let you easily build granular lists of prospects to call. Interested? Request your free full demo!
Salesforce reports and dashboards are analytical tools within the Salesforce platform. Reports provide detailed data analysis based on specific criteria, while dashboards offer a visual summary of these reports, presenting key metrics and trends in an easily digestible format, enabling businesses to make informed decisions.
In Salesforce, dashboards can vary based on the data they display and their intended audience, but fundamentally, they include:
To access reports and dashboards in Salesforce, navigate to the “Reports” or “Dashboards” tab in your Salesforce interface. If these tabs aren’t visible, click on the “App Launcher” (grid icon) and search for “Reports” or “Dashboards.” Here, you can view, create, and manage your reports and dashboards.
Anzhelika is a seasoned B2B content marketing strategist with extensive experience in elevating corporate profiles through compelling content. At Ascendix, she offers a wealth of knowledge in Salesforce consulting, providing valuable tips, tricks, and comprehensive guides. Additionally, Anzhelika stays at the forefront of the industry, delivering expert analysis on the latest Salesforce tools and emerging technology trends.
 (21 votes, average: 5.00 out of 5)
Search for Salesforce records from multiple locations by drawing geometric shapes on a map and convert Salesforce lists to a map easily with Ascendix Search!