Great article! Generating Salesforce reports can be complex, but using AI tools like Einstein Copilot simplifies the process.
Assadullah Shaikh
Salesforce offers you a powerful reporting tool that helps to understand your data.
In this post, we’ll show how to create Salesforce reports, export them to Excel, subscribe to Salesforce reports, and place them to the dashboard.
The Salesforce report is a standard object that helps you to summarize data and see them in a meaningful fashion. Among the reasons why you may need Salesforcereports is when you need to export the data to Excel or to build the dashboards. Also, due to the Salesforce report, you can make a data analysis based on your client’s requirements.
Salesforce standard report type
You can find various explanations on the Internet on how to create reports, but before you do it, pay attention to the Salesforce report types and formats, so you’ll understand clearly their peculiarities.
There are two different report types:
A report format is a set of records and fields that meet the defined criteria.
There are four Salesforce report types: Tabular, Summary, Matrix, and Joined. The tabular report is the default format.
In Salesforce Lightning there’s is now no longer a drop-down where you can choose the report type.
Our Salesforce Consultant Chris Petersen recorded a detailed video on how to create reports in Salesforce.
If you need to build a Salesforce report, you can do it easily by following the procedure described below.
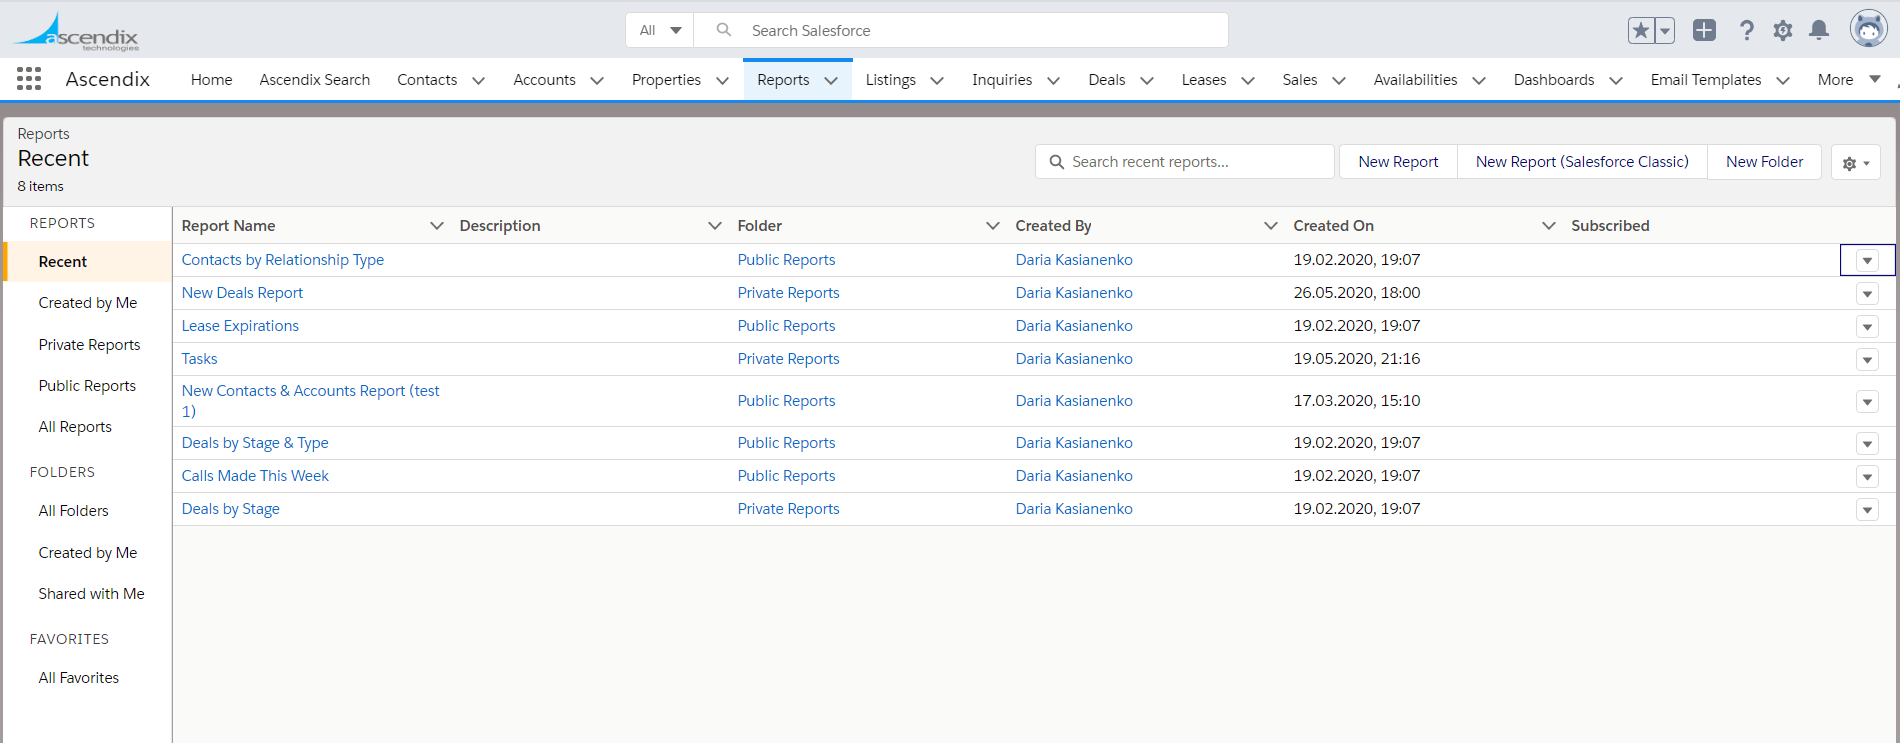
To find a Salesforce report, you need to look at your horizontal navigation bar for the “Reports” object.
If you don’t see this tab in the bar:
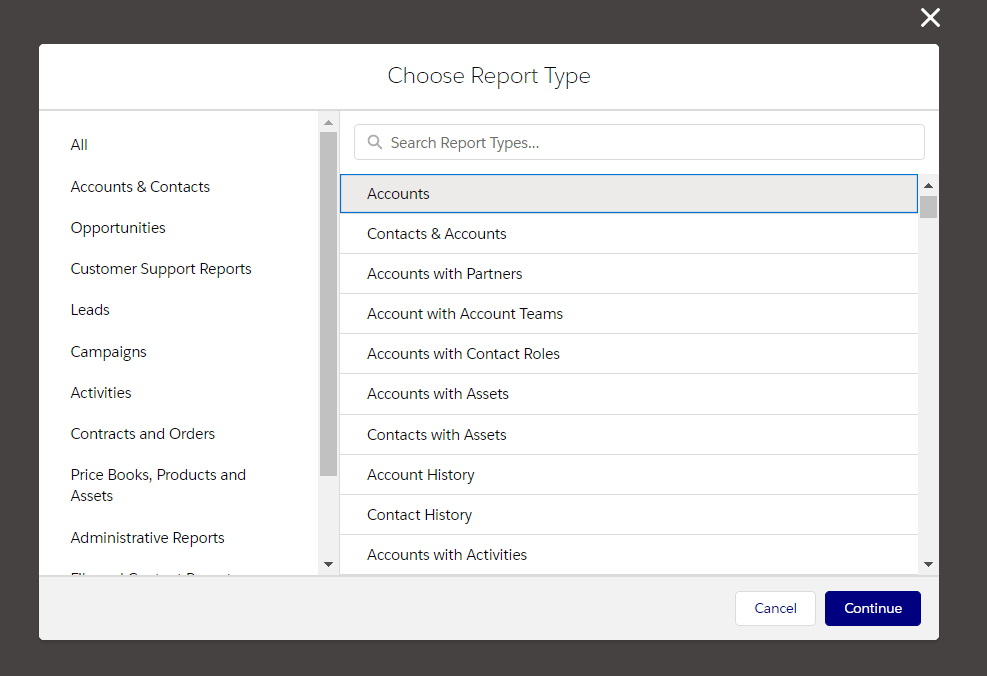
Choose the Salesforce report type
Select the Salesforce report type and click on the “Continue” button. Note, that the list of reports is quite exhaustive and ranges from various types of “Accounts”, “Opportunities” to “Deals”, “Cases” etc. To simplify your search, you can start typing in some keywords. For example, if you want a report on your deals, you can click and type in “Deals”, and you will see the suitable results for that.
Filtration is one of the key features if you have big lists of data. To begin selecting the scope of the Salesforce report using the standard Salesforce report filter logic, click the “Filters” panel.
Let’s say, you might want to filter reports only on the open deals. To do that search you will need to:
If you want to add any other filters using Salesforce report filter logic, you can click on all these field names and decide what other fields you might want to report on.
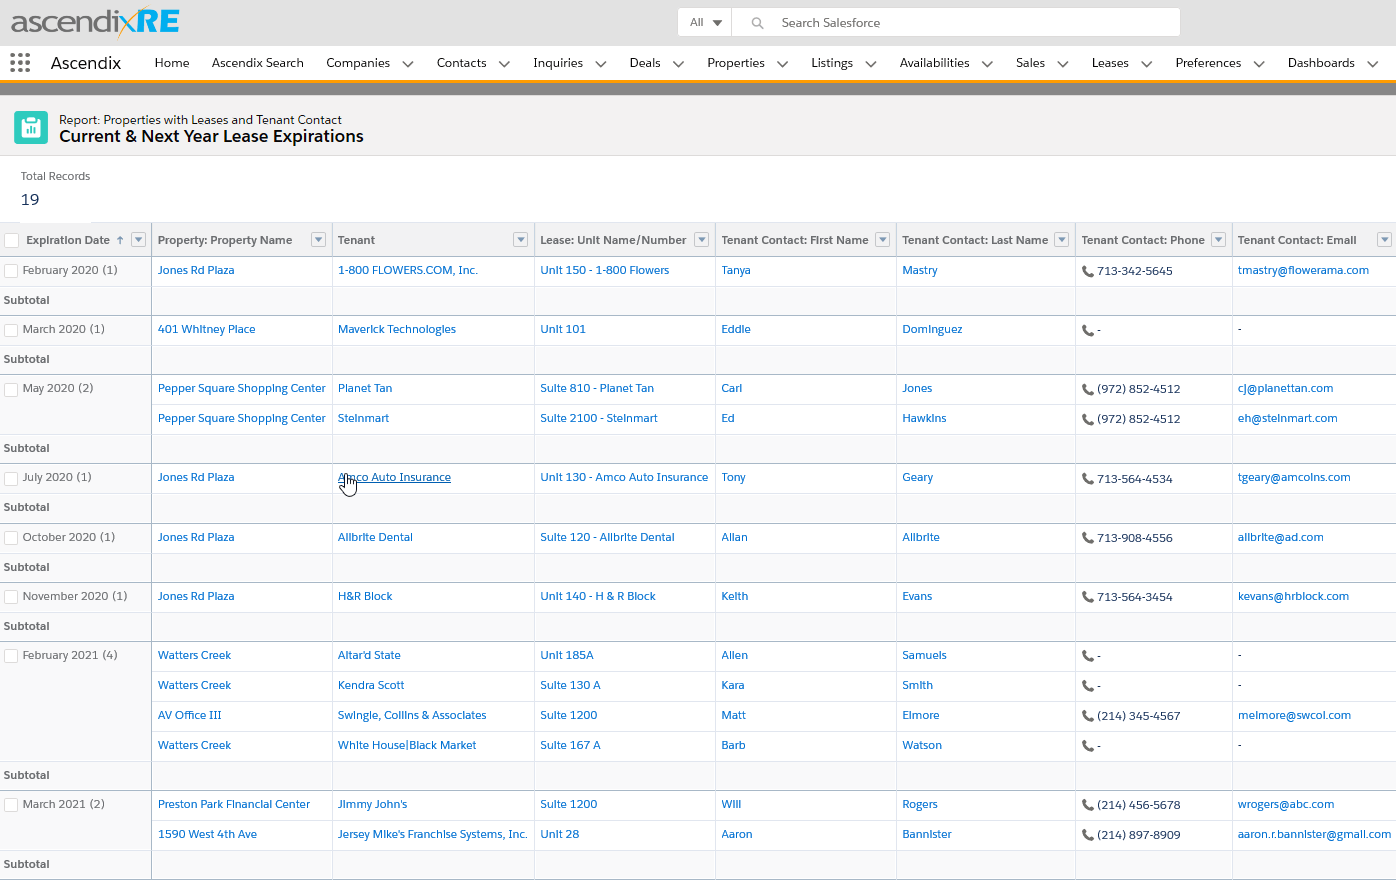
With the help of the “Outline” pane, you can add and remove columns with a simple drag-and-drop feature.
For example, the Deal name is not likely to be sufficient in the report. Potentially, you want to add an estimated closed date, so you could just type “Est. Close Date” in the Columns section and it will filter your results. You can double-click or click and drag the field over to the report on the right and to the respective location you need.
If you want to do the estimated closed date as the grouping, you can type in the “Groups” section “Est. Close Date” and your results will be filtered again
In the case of grouping “Deals” by “Est. Close Date” you can also group the data by Day, Calendar Week, Calendar Month, etc.
To save your Salesforce report, you will need to:
We offer all types of Salesforce consulting services such as implementation, integration, customization, administration, AppExchange app development.
There are two main methods on how to delete a report:
To delete the Salesforce report from the Reports tab you need to go to the “Reports” at the Navigation Bar. Then click the Arrow Down button next to the report you want to delete and choose “Delete”.
To delete the report from the report’s run page, click the “Arrow down button” and choose “Delete”.
To edit click the Arrow Down button and choose “Edit”.
If you want to receive report notifications to keep you updated, you can turn on the subscribe feature.
Click on the “Reports” at the Navigation Bar.
Next to the report, you want to subscribe to, click the “Arrow Down” button and choose “Subscribe”.
Schedule how often (every weekday, daily, or weekly) and at what time to evaluate your subscription. For example, run the report every week on Friday at 7 p.m.
Please, note that you can add conditions at this step by specifying each condition in three parts:
Click on “Save”. Make sure the subscription is active if you’re ready to start receiving notifications.
If you wonder how to unsubscribe from a report in Salesforce, here are simple steps for Salesforce Lightning and Salesforce Classic:
To find out which are the subscribed reports, you can select the drop-down from the list view, called “Items I am Subscribed to“.
We have 20+ years of experience in Salesforce customization, configuration, and best custom development practices.
Follow these 3 Steps to export your report to Excel.
To select the Salesforce report to export:
Choose the Salesforce report to export
If you choose Formatted Report, Salesforce exports it with the report header, groupings, and filter details. In this case, the export file type is .xlsx.
The Details Only Report exports each detail row without formatting. You can set the Format to Excel Format .xls or Comma Delimited .csv.
Click on the “Export Button”.
If you want to take a Salesforce report and put it on a dashboard you should follow the next steps.
Go to the dashboards tab, pick a dashboard, and click on “Edit”.
A list of the available reports will be shown to you. Select the report which you would like to add.
Choose how the report will be shown to you:
At this step you can customize your Dashboard Component:
Please note that you can Customize chart colors from the dashboard properties menu:
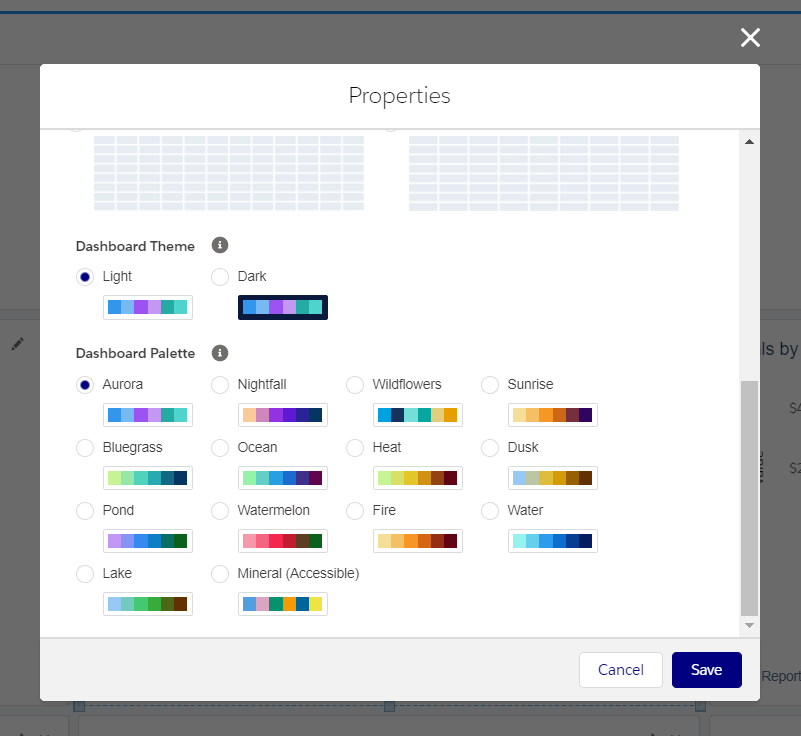
Customize colors in the Salesforce dashboard
Click on “Add”. It essentially adds itself to the dashboard, but you can drag and drop that component up. If you need it to go to the very top you just continue to do that to replace the widgets and save.
Salesforce reports are an advanced feature and they offer you much more functionality to search for your data in comparison to Salesforce Global Search and List views.
But what if you want to be able to build even more complex search requests, use maps to narrow your results, or simply be able to mass edit your records? We built Ascendix Search app to upgrade your Salesforce experience and let you easily build granular lists of prospects to call, mass email, or stay in touch with.
Do you still have questions about Salesforce custom report types or need help with your Salesforce org? Our Salesforce consultants are happy to help! Get in touch with us.
To create a report on Salesforce, follow these steps:
To create a report type in Salesforce Lightning:
To create a case report in Salesforce:
We are a team of CRM consultants, developers, data analysts from the United States and Europe. Since 1996, we've been helping companies make the most out of CRM software and improve their software systems.

 (44 votes, average: 4.90 out of 5)
Great article! Generating Salesforce reports can be complex, but using AI tools like Einstein Copilot simplifies the process.
How do I add a new field to a report? For example: on the opportunity there is a field Primary Campaign Source but it doesn’t seem to be a standard field.
Hi Kristi,
To add the field to the report you need to:
Edit the Report:
Go to Reports and find the report you want to edit.
Click on the report to open it.
Click Edit.
Add the Field to the Report:
In the report editor, on the left-hand side, search for the Primary Campaign Source field in the Fields pane.
Drag the Primary Campaign Source field into the report preview pane where you want it to appear.
Save the Report:
Click Save to save your changes.
Optionally, you can use Save As to create a new report with the changes if you don’t want to overwrite the original report.
Hope it was helpful.
Anyway, if you need more help, feel free to ask.
Regards,
Ascendix Search lets you do more with your Salesforce data: create lists of prospects, track all activities, keep your Salesforce clean and up to date, automate repetitive actions, and get more time for high-value work.
Need training in IF conditions in salesforce reporting.